Predicting the Orbital Obliquities of Exoplanets Using Machine Learning
In my previous blog post (see Part 4), I built a random forest classifier model to predict whether orbital obliquities are aligned, misaligned, or highly misaligned. While the model had some success, its performance was limited due to dataset imbalance, where the majority (~60%) of obliquities were aligned, leaving fewer examples for the other two categories (~15% and ~25%, respectively). This small dataset (226 systems) constrained the model's ability to generalize effectively.
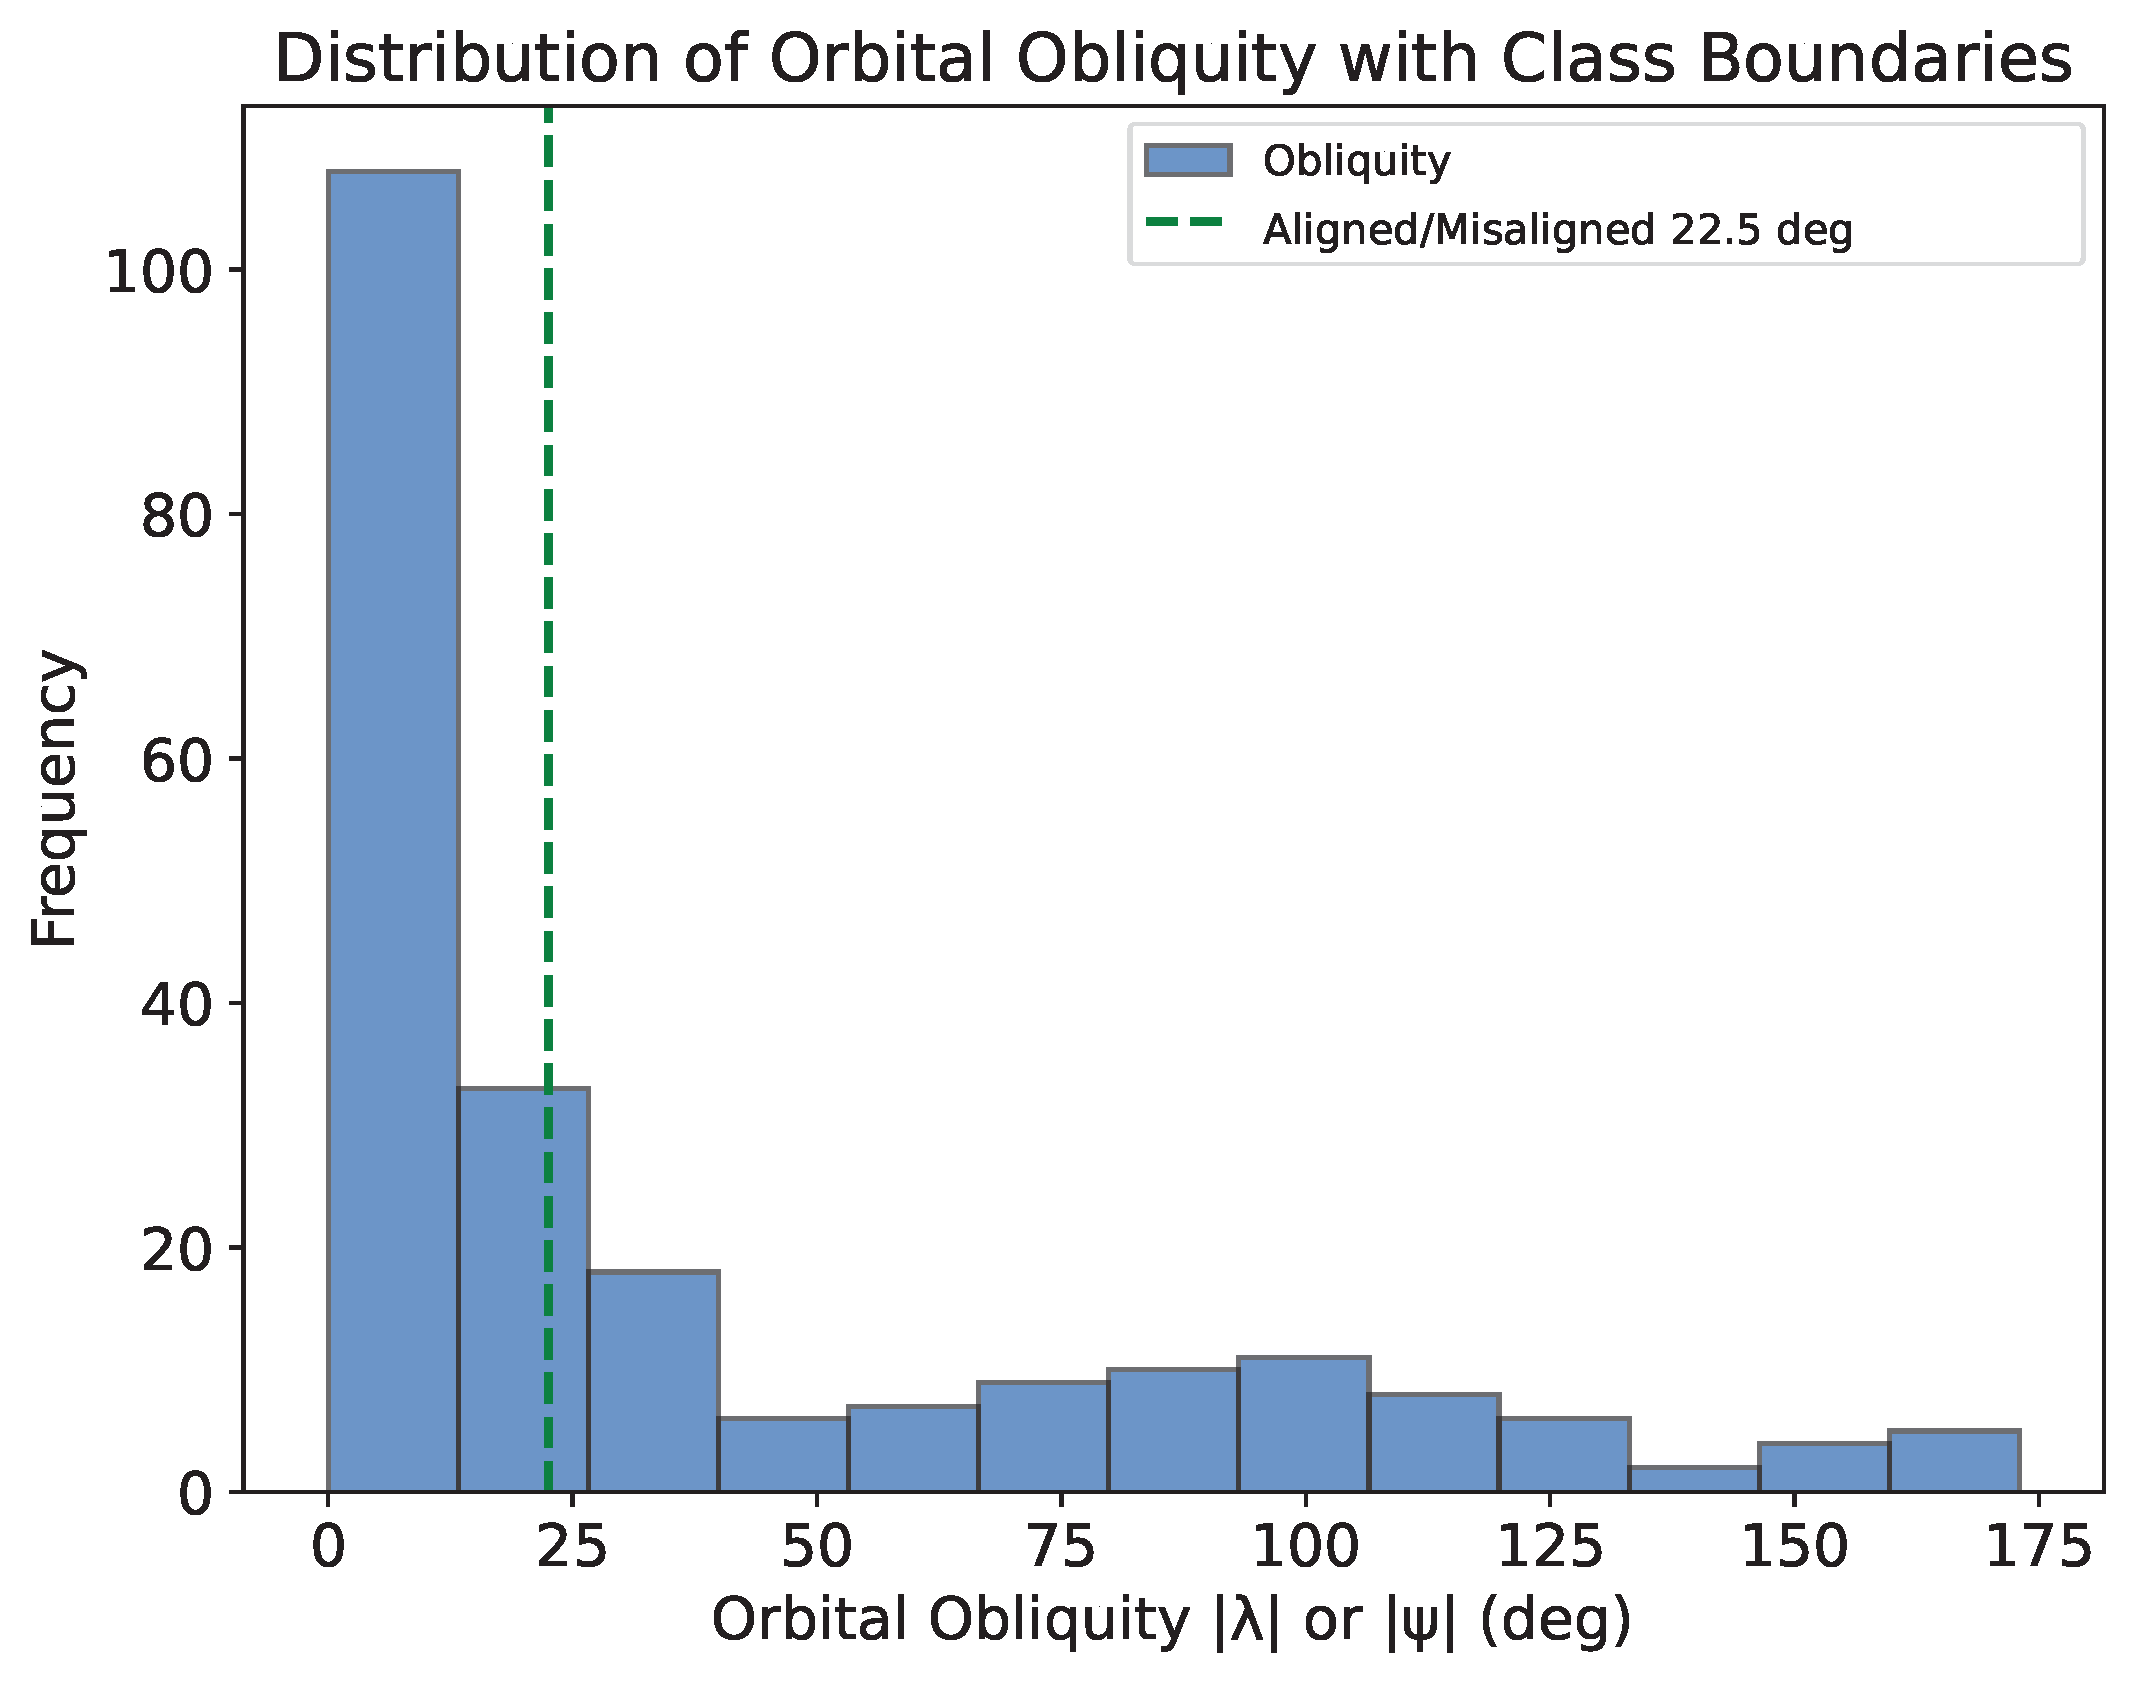
To improve performance, I reduced the classification to just two categories: aligned (λ < π/8 or λ < 22.5°) and misaligned (λ ≥ π/8 or λ ≥ 22.5°). This adjustment created a more balanced dataset (60% aligned, 40% misaligned), compared to the distribution across three categories (as illustrated by the figure at the top of the page), and improved training diversity.
Results of the Binary Classifier Approach
The two-category random forest classifier was trained and tested using a 70/30% dataset split. Below are the evaluation metrics:
| Metric | Average Weighted Score (Binary Classifier) | Average Weighted Score (Three-Category Classifier) |
|---|---|---|
| Accuracy | 0.792 | 0.818 |
| Precision | 0.801 | 0.812 |
| Recall | 0.792 | 0.818 |
| F1-score | 0.795 | 0.798 |
| Class Category | Precision | Recall | F1-score |
|---|---|---|---|
| Aligned (Binary Classifier) | 0.87 | 0.81 | 0.84 |
| Aligned (Three-Category Classifier) | 0.82 | 0.98 | 0.89 |
| Misaligned (Binary Classifier) | 0.66 | 0.75 | 0.70 |
| Misaligned (Three-Category Classifier) | 0.00 | 0.00 | 0.00 |
| Highly Misaligned (Three-Category Classifier) | 0.92 | 0.56 | 0.70 |
While overall performance did not significantly improve, the binary classifier successfully classified misaligned planets, unlike the three-category model, which misclassified the entire category.
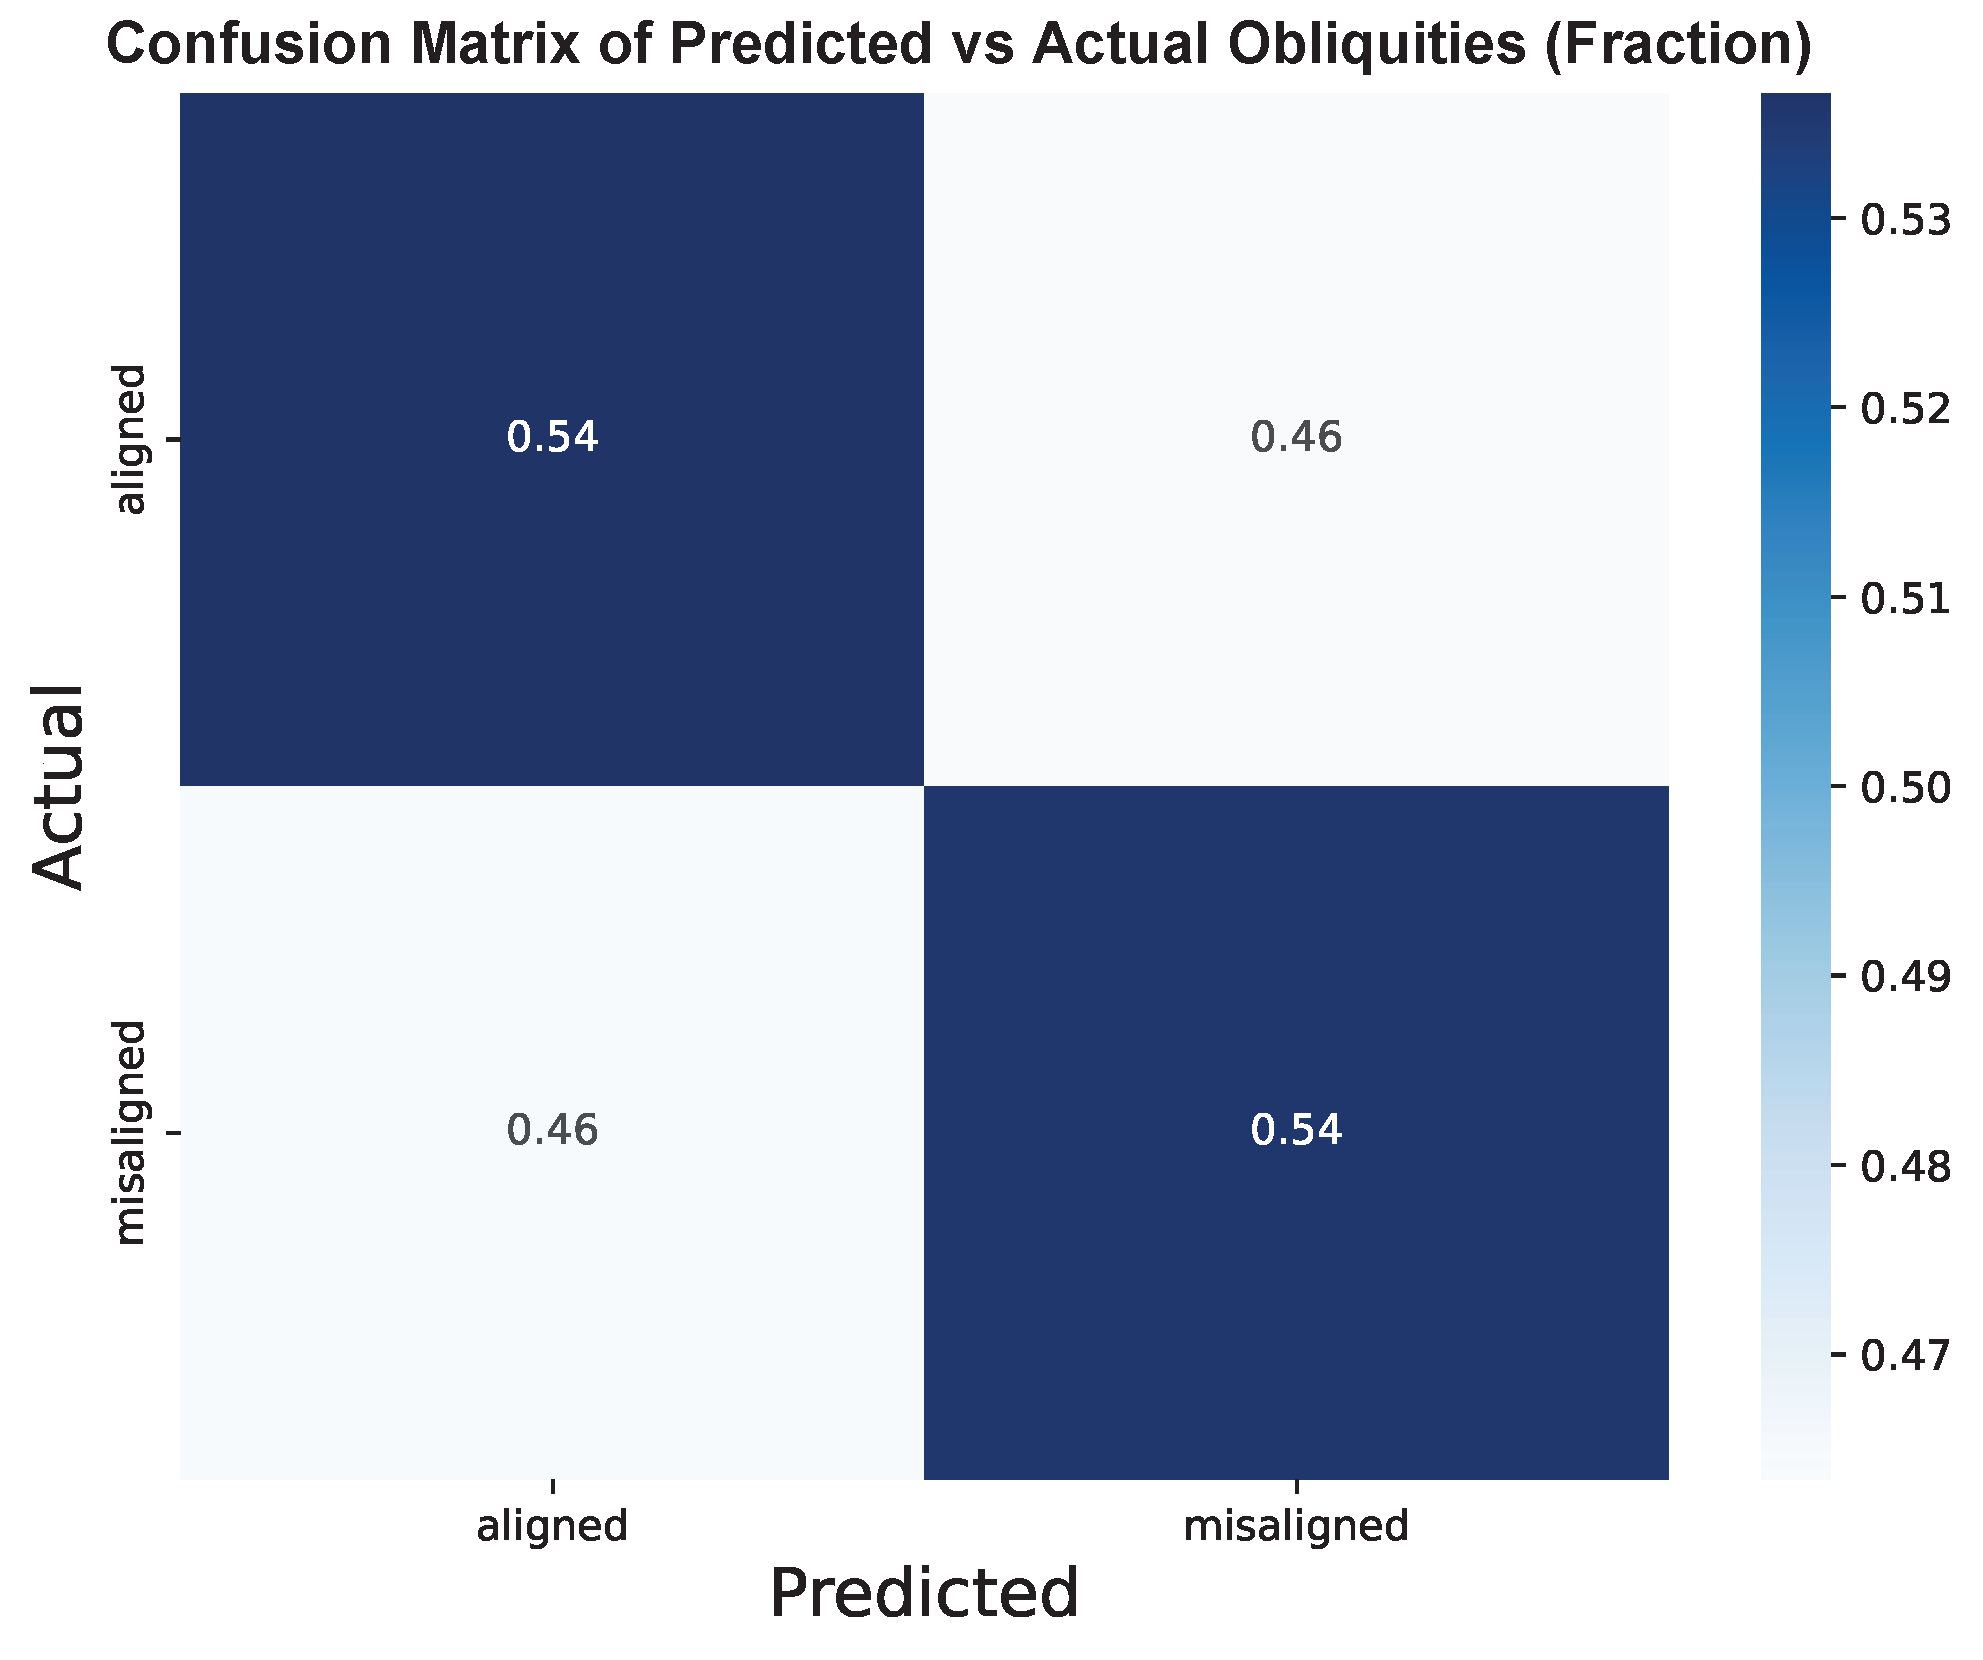
The confusion matrix below provides a visualization of the performance of the two-category classifier model based on weighted counts (factoring in uncertainties on the obliquities) and the fraction of the raw counts (not factoring uncertainties).

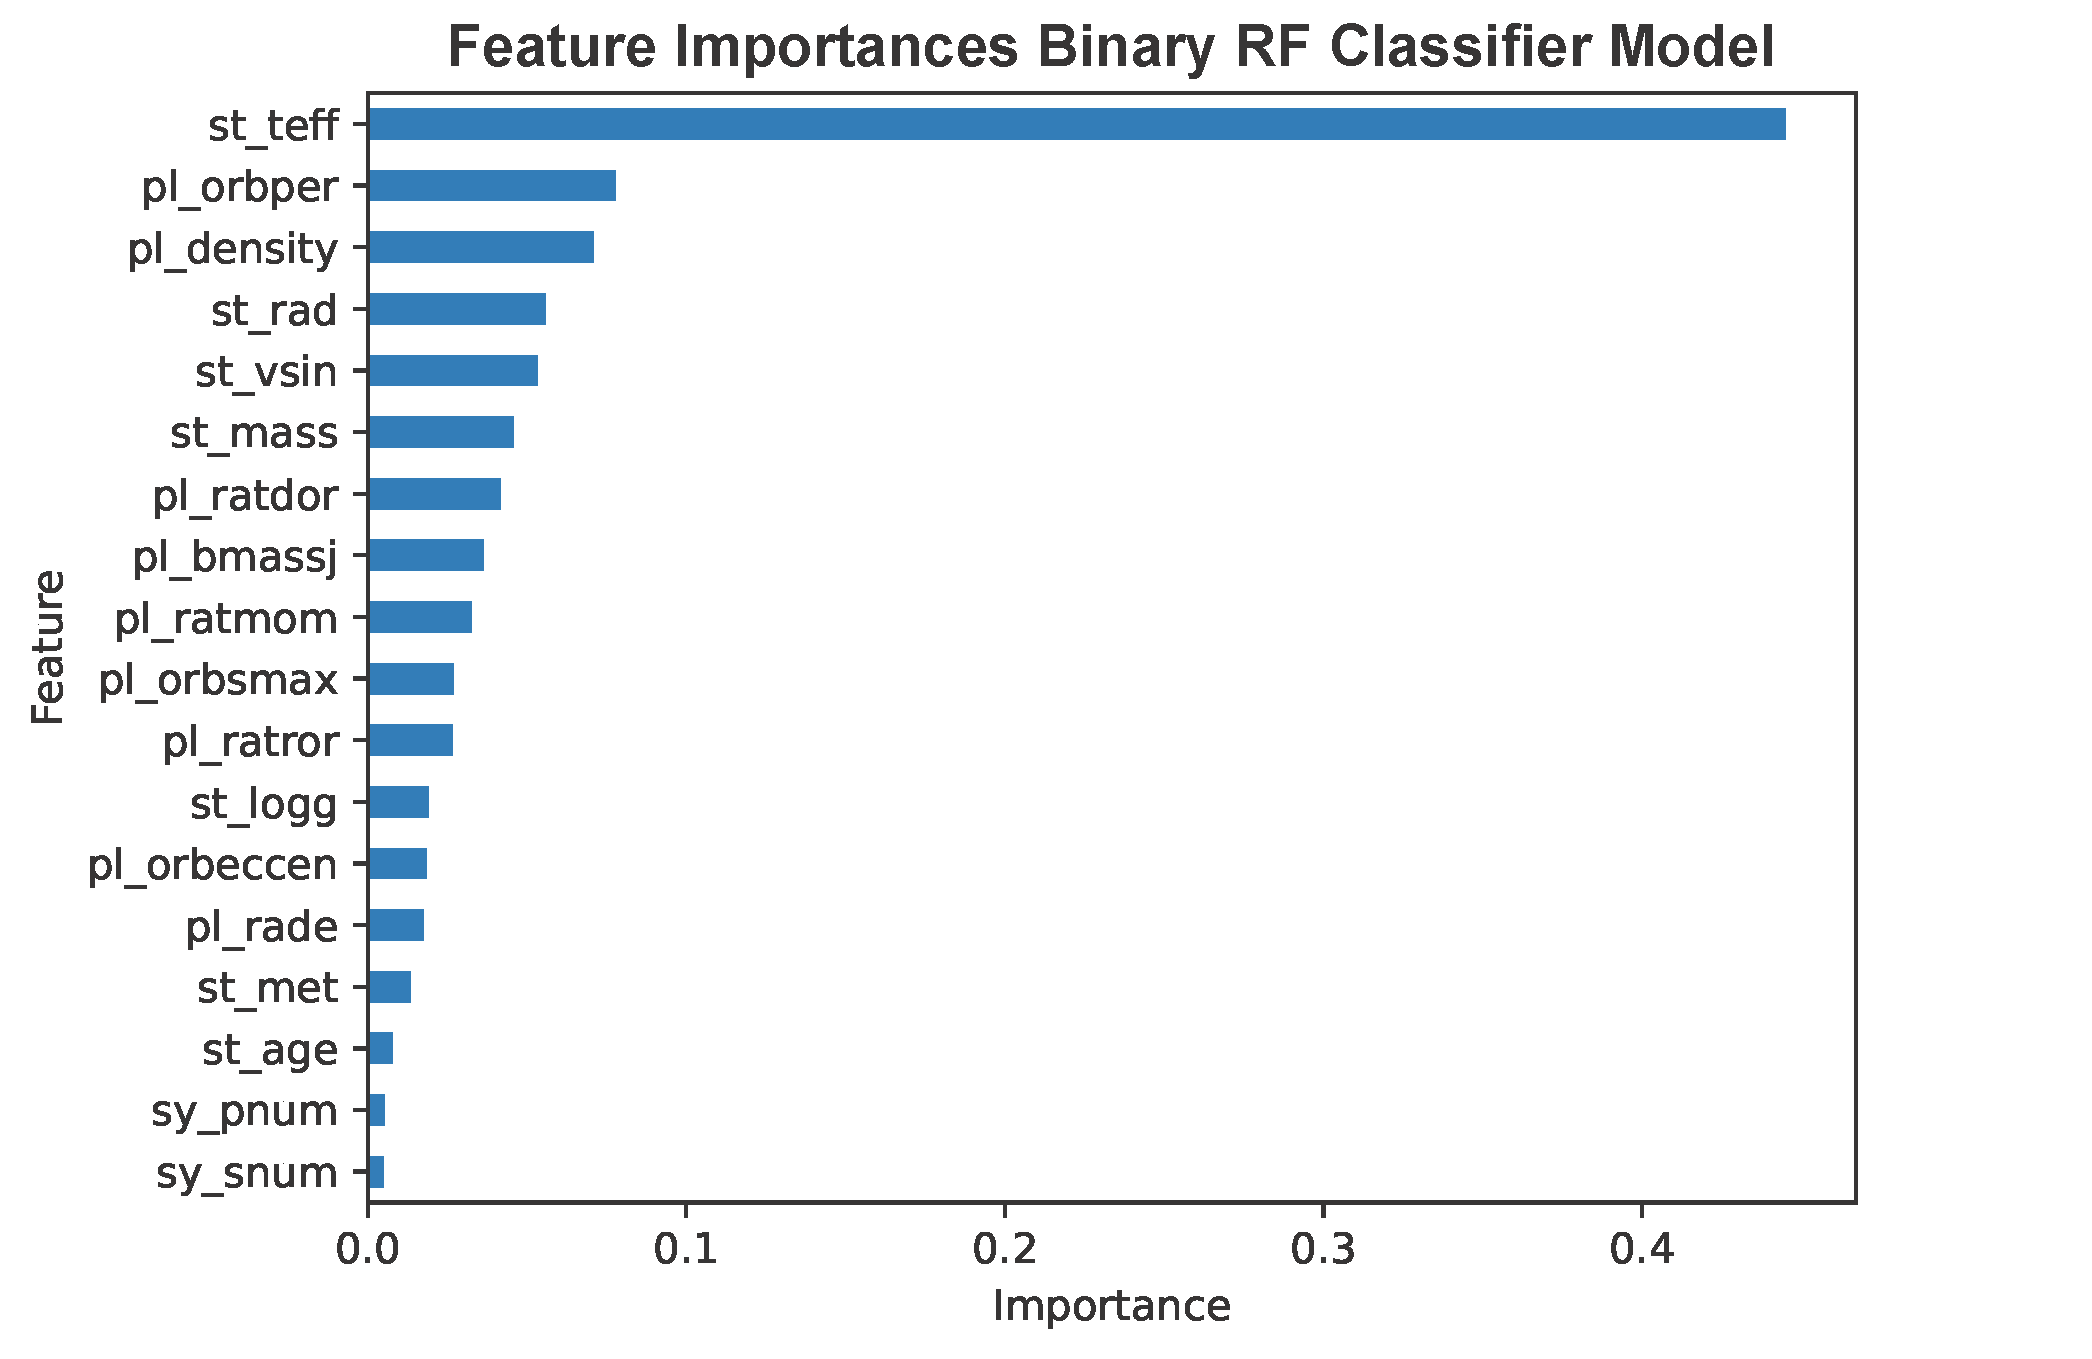
Feature Importance
Examining feature importance, stellar effective temperature ('st_teff') dominated the model, unlike the three-category classifier where several features were comparably important (see Part 4). This suggests a shift in how the model prioritizes features when reducing categories.
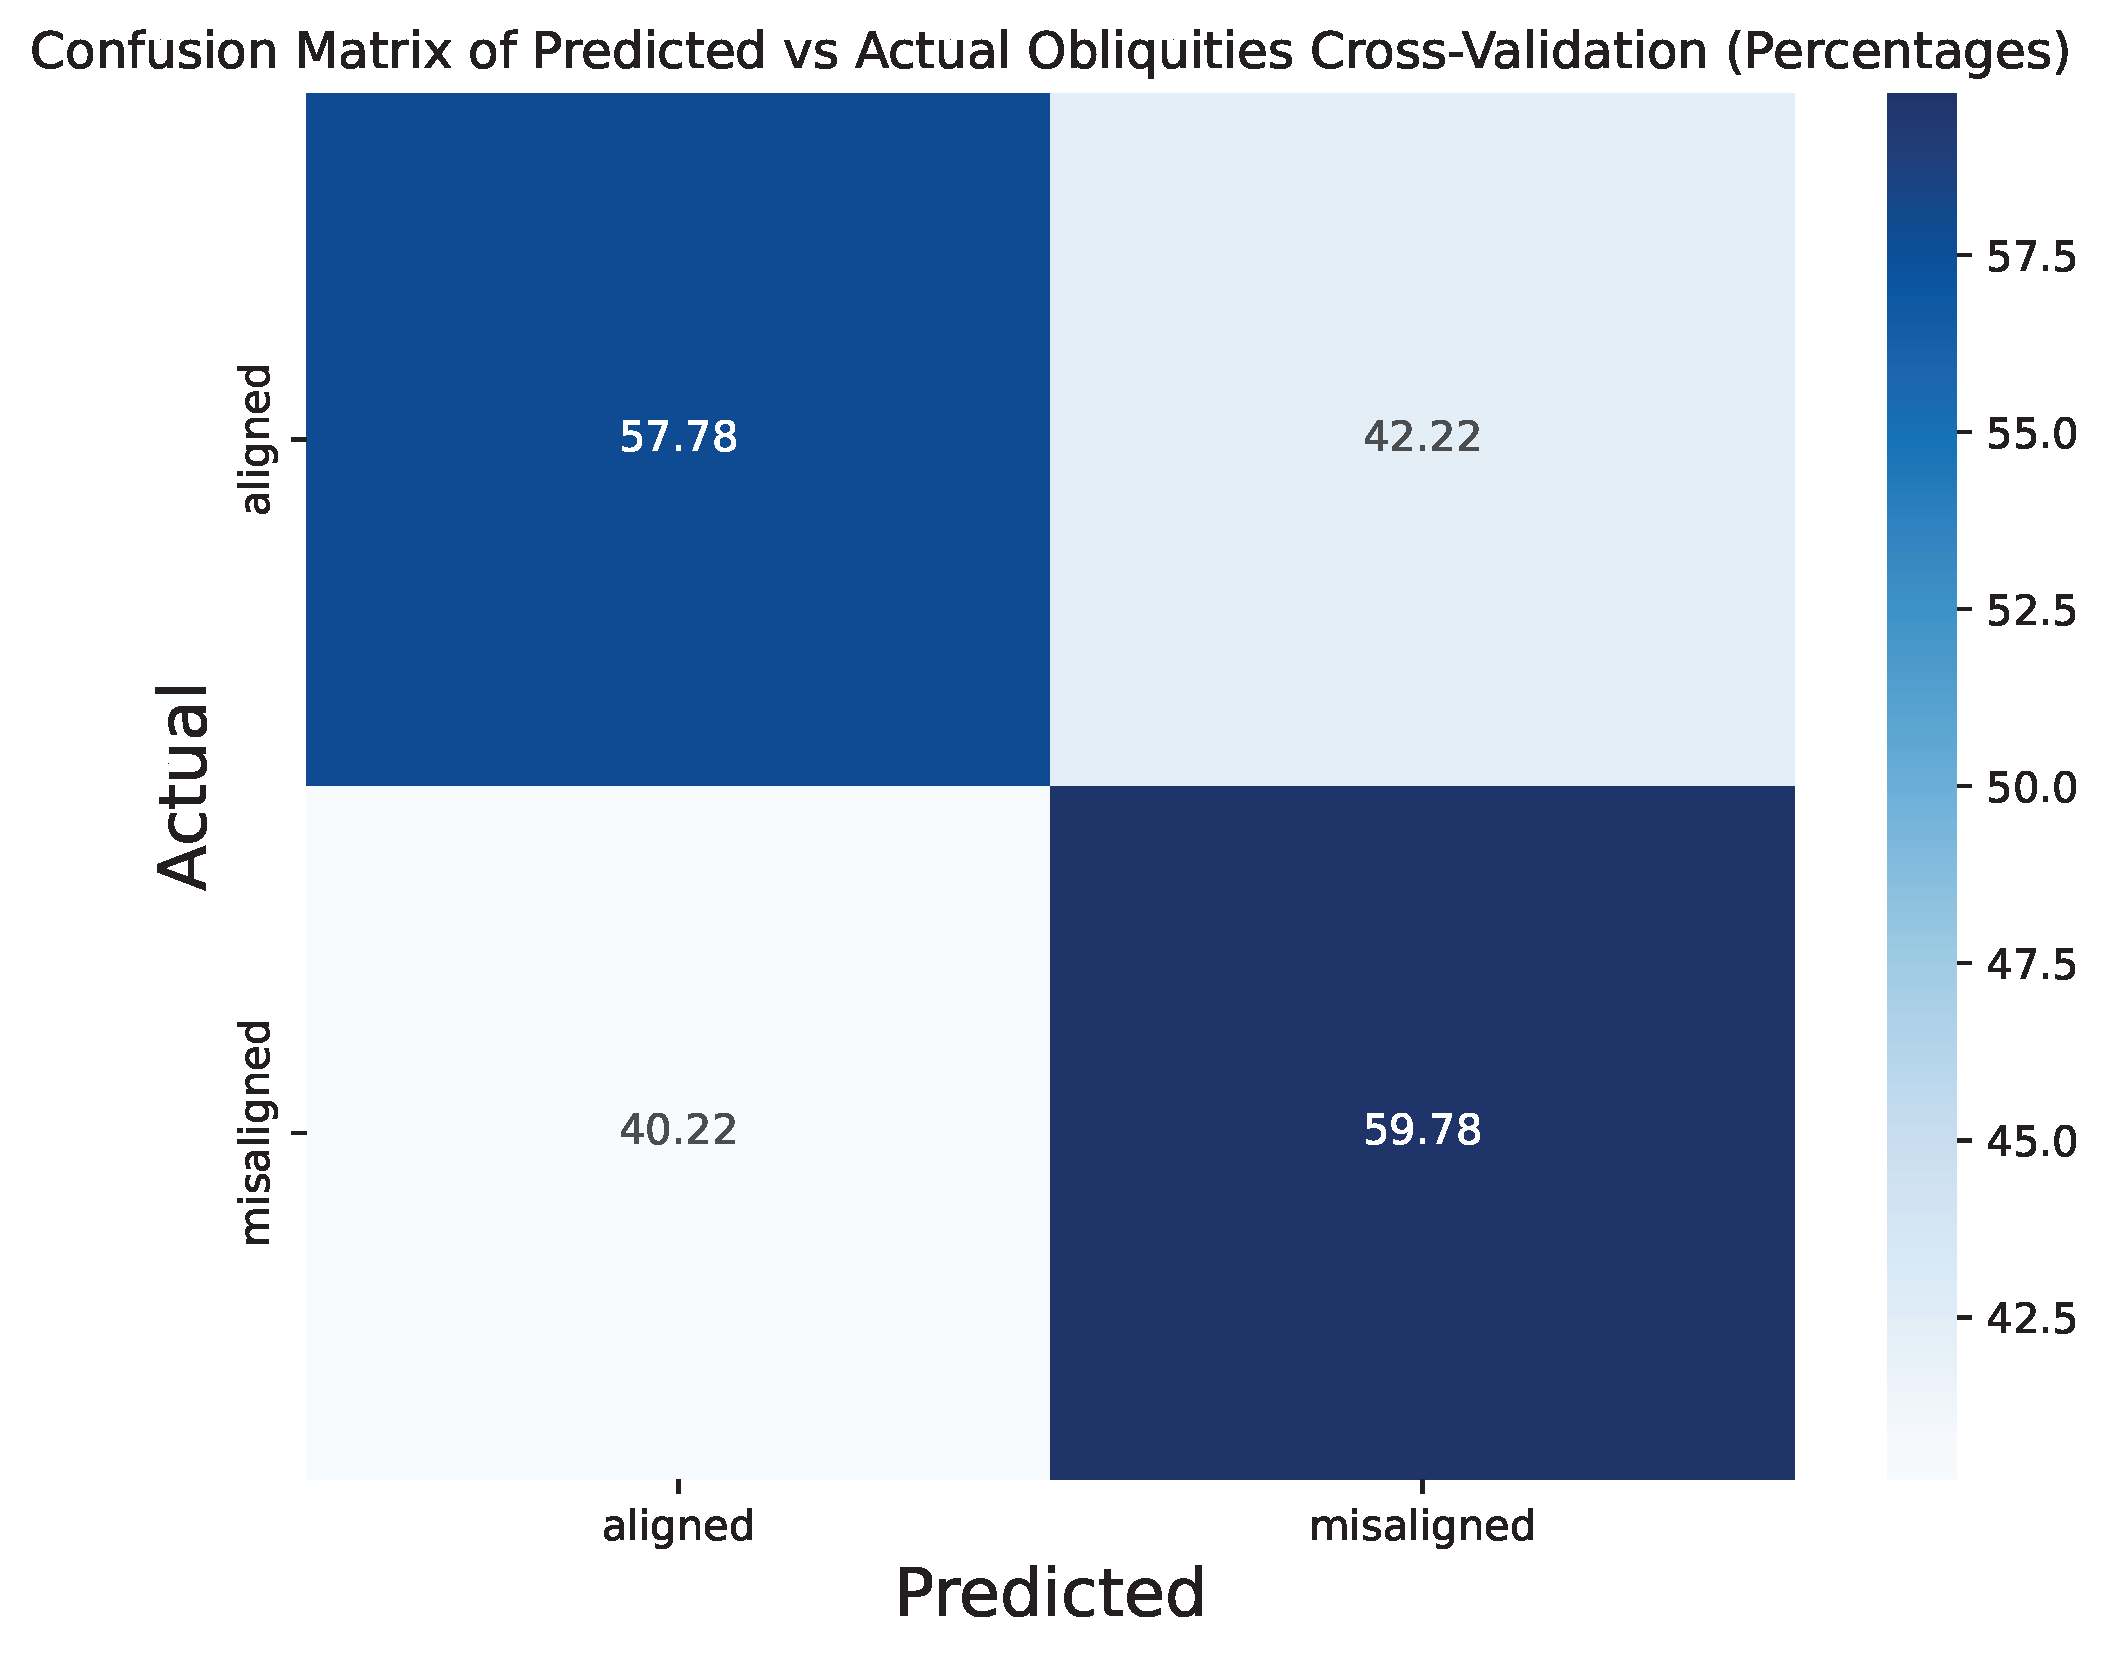
Cross-Validation Results
To verify these results, I conducted 10-fold cross validation of the two-category model, which show similar performance across models. The below two figures show the confusion matrix in terms of weighted counts and the percentages of the raw counts.

Key Takeaways and Future Work
In summary, both random forest regression and classifier models struggled to accurately predict the orbital obliquities of exoplanets given the available datasets. Several methods were pursued to try to improve the predictive power of the models, such as:
- Data augmentation to account for uncertainties,
- Physical model based derivation for missing values,
- Feature engineering,
- K-fold cross validation.
Despite these efforts to improve the models, challenges still remain likely due to:
- Small dataset size (226 exoplanets with measured obliquities),
- Imbalanced sample of obliquities (more planets on low obliquity orbits than high obliquity orbits),
- Weak feature correlations with obliquity.
It is worth noting that the Gaia space telescope, an astrometry mission that is providing extremely precise positions, motions, and distances to nearly two billion stars in the Milky Way galaxy, will provide in the near future additional features (e.g., 3D planetary orbits, stellar multiplicity, etc.) that could improve the obliquity predictions made by these models. Additionally, the sample of planets with measured obliquities will continue to increase that will help further improve these model predictions.
While my models encountered challenges in making accurate predictions, this project provided valuable insights into data pre-processing, feature engineering, and the complexities of applying machine learning to astrophysical data.
In future blog posts, I will explore the use of other machine learning techniques on this dataset such as Extreme Gradient Boosting (XGBoost) and Bayesian models that can better incorporate uncertainties. Additionally, I will investigate techniques to address the imbalance of the sample of orbital obliquities.
Summary of the skills applied in this work: Python programming, Data Visualization, Machine Learning, Random Forest Classification, K-Fold Cross-Validation.
< Previous Post | Data Science Home Page ⌂